

Records Set For Annual Sales & Market Shares
Store brands across the U.S. closed the books on 2024 with new records set in annual sales and dollar and unit market shares.
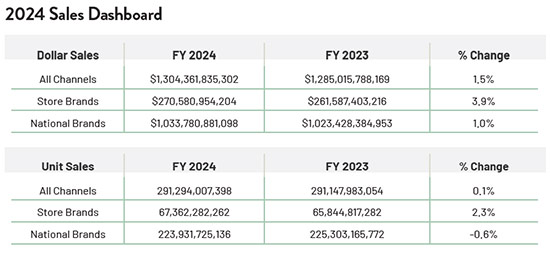
The topline numbers tell a compelling story. Store brand dollar sales in all outlets increased 4x that of national brands last year as the products surged ahead 3.9% compared to a gain of only 1% for their branded counterparts. Looking at unit sales, the head to head disparity was much the same. Store brands advanced 2.3% versus the figure for all of 2023 while national brands dropped -0.6%.
As a result of this enthusiastic response to the products by shoppers at the country’s checkouts, store brands (or private label, retailer brands, own brands) set all-time highs in both key market share metrics — moving up to 20.7% in dollar share and to 23.1% in unit share, for the period from January 8 to December 29, 2024, reports PLMA, per data from Circana Unify+.
One of every four food and non-food grocery products purchased throughout the U.S. during the year carried the store’s name or one of its proprietary brands.
Total store brand sales volume for 2024 surpassed a quarter trillion dollars, coming in at $271 billion, an increase of $9 billion over the prior 52 weeks and establishing an all-time high in annual revenue. Sales of store brand units were up 1.5 billion to 67.4 billion, another record.
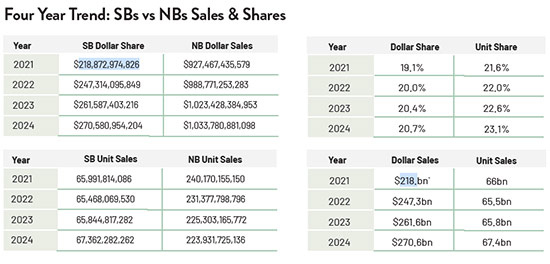
Taking a longer view, annual dollar sales of U.S. store brands increased by $51.7 billion, or plus 23.6%, over the past four years — from 2021 to 2024 — while annual store brand unit sales moved ahead 2.1%, or up 1.4 billion. By comparison, over the same period national brands gained 11.5% in annual dollar sales but slumped -6.8%, or down 16.2 billion, in annual unit sales.
Increases in market shares signal store brands’ superior multi-year performance vs national brands. Store brand dollar share rose 1.6 points from 19.1% in 2021 to 20.7% in 2024 while unit share advanced 1.5 points from 21.6% to 23.1%.
Pulling more than their own weight, store brands accounted for nearly half, 47%, of all sales gains last year in U.S. retailing (or $9 billion of the industry’s $19 billion overall growth).
Store brand sales finished the year on the upswing, perhaps auguring a strong start to 2025. Over the second half, from July 14 through the balance of 2024, dollar volume gained 4.6%, vs plus 3.5% for the first six months.
“We are gratified that the new numbers represent an end of the sharp sales volatility of the last several years and a return to the steady state to which our industry is historically accustomed,” says Peggy Davies, PLMA President.
“Middle single digit increases year over year are a sweet spot where store brand sales have traditionally found themselves. Sales spikes — up and down — such as we experienced earlier this decade wreaked havoc on the supply chain, the sourcing of ingredients, meeting packaging needs, human resources, capital requirements, pricing, and corporate planning, among other operational issues.”
Departmental sales provide a comprehensive picture of the 2024 results. All ten food and non-food sections finished ahead of the prior year in store brand dollar sales with the two largest departments — Refrigerated (+ 7.5%) and General Food (+4.3%) — gaining the most. Beverages were up by 4%, followed by Beauty (+3.7%), Home Care (+3.4%) and Frozen (+3.3%).
Looking at total departmental store brand sales, Refrigerated was again the largest with $57.7 billion, followed by General Food ($51.7 billion), General Merchandise ($25.5 billion), Frozen ($21.6 billion), Home ($18.5 billion), Beverages ($14.4 billion), Pet Care $5.3 billion) and Beauty ($3.8 billion).
When it came to store brand unit sales, nine departments improved. Leading the way were Beverages and Pet Care, which both rose 3.5%, followed by Home Care (+3.3%), General Food (+2.8%), Refrigerated (+2.7%), Frozen (+2.1%), Beauty (+1.9%), and General Merchandise (+0.1%). Only Health declined at -0.4%.
The top departments for total store brand unit sales were General Food (18.8 billion), Refrigerated (14.9), General Merchandise and Beverages (both 4.9 billion), Frozen (4.6 billion), Health (2.4 billion), Beauty (974 million), Pet Care (931 million) and Home Care (736 million).
In market shares, store brands increased in food and non-food product departments across the board.
Store brand unit share rose in every department, with the best gains in General Food, +0.7%, followed by Beverages, General Merchandise and Home Care, all +0.5%. Share is highest in General Merchandise at 41.4%, next are Refrigerated (38.4%), Frozen (27.5%) and Health (25.5.%).
As for store brand dollar share, the largest gains were in Frozen (+0.6%), General Food (+0.5%) and General Merchandise (+0.4%). Top store brand dollar shares were in Refrigerated (36.4%), General Merchandise (33.4%) and Frozen (25.9%).
Drilling down further, store brand expansion occurred in a majority of categories. The products racked up dollar sales gains in 129 of the 167 edible categories (77% of them) in which they were sold and enjoyed unit sales improvement in 118 (71%). Among the 153 non-edible categories that offered store brands, dollar sales growth was recorded in 79 (52% of them) and there were unit sales increases in 85 (56%).
PLMA’s Davies pointed to a statement by former Kroger Kroger CEO Rodney McMullen as an excellent explanation of private label’s ascension and the strategic importanceof the products to retailers and consumers.
McMullen told investors, “The profitability of Our Brands is several hundred basis points higher than national brands. And if the CPGs are willing to continue to give up share to Our Brands we’re OK because we find once a customer tries Our Brands the repeat rate of their coming back is incredibly high because what they find is there’s no compromise on quality, and they have great value for the money.”